The cargo turnover was increased by containers in Klaipėda Port in the first half-year
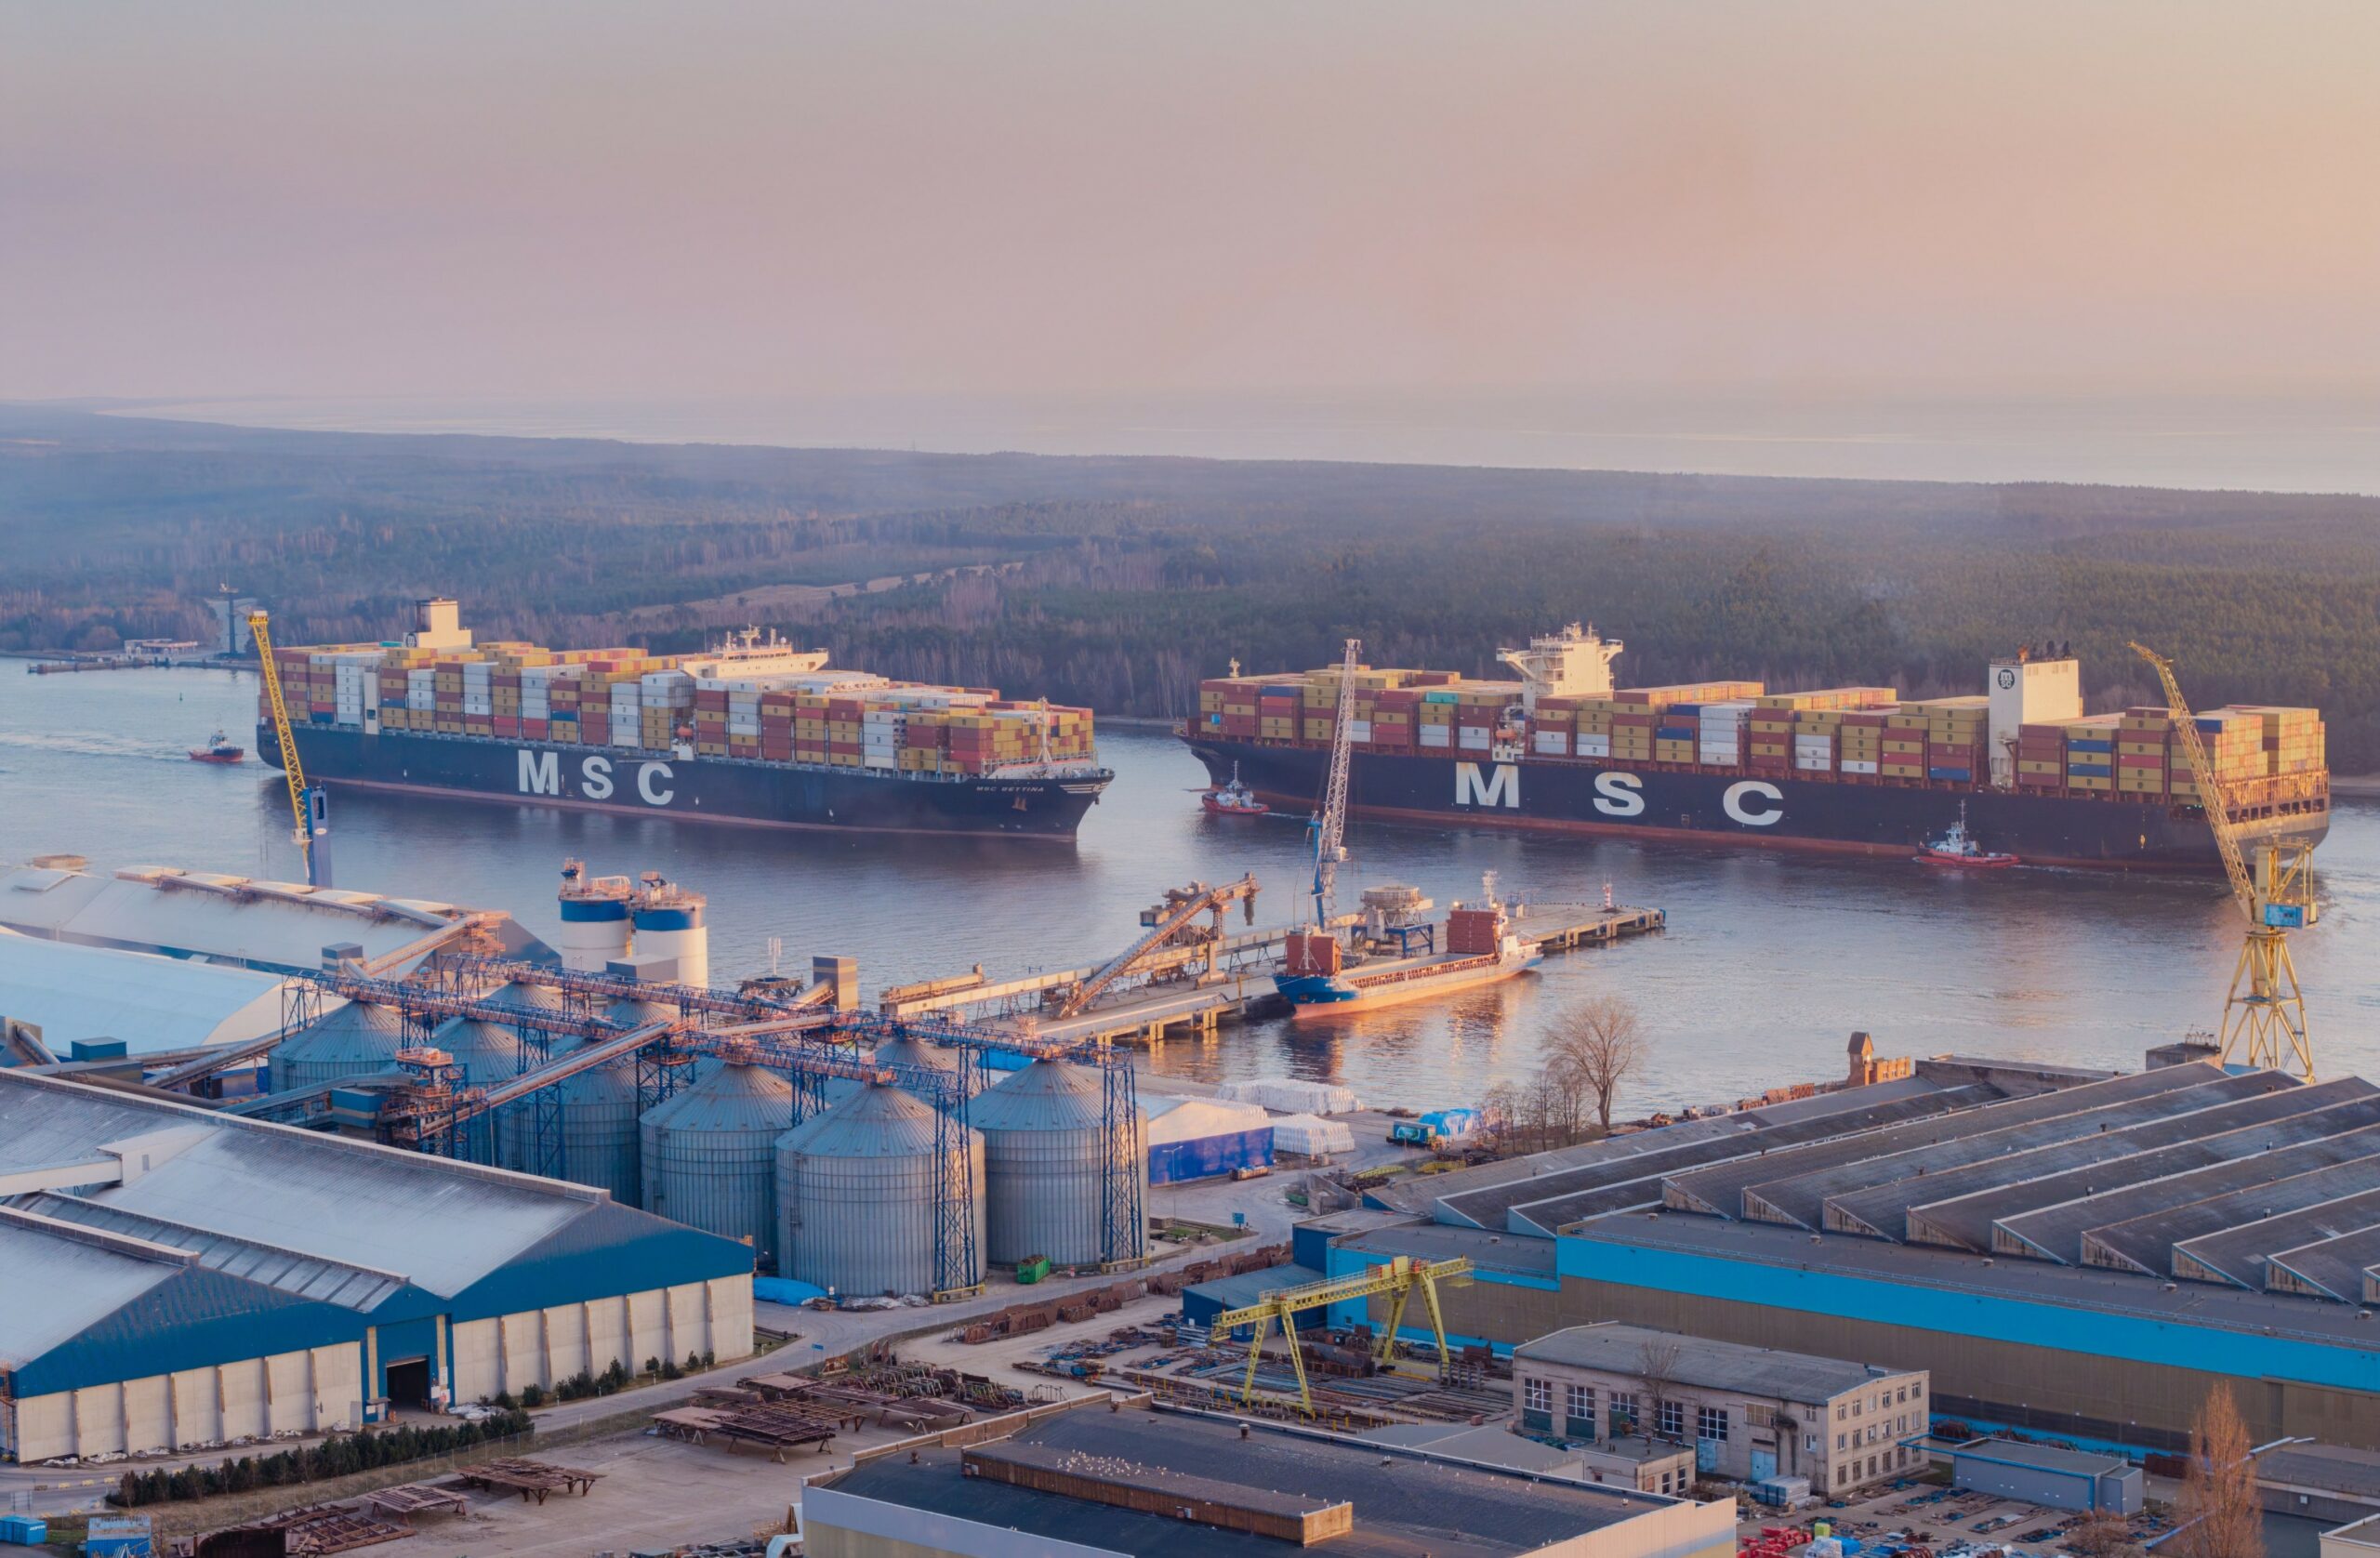
Regardless of part of the cargoes lost due to sanctions, more than 18 million tons of cargoes were stevedored in Klaipėda Port in the first half-year and the leap in sea cargoes was recorded. According to total cargo turnover in the first half-year, Klaipėda Port remains in the strong fourth place among the ports of the Eastern Baltic coast.
“Despite of a difficult and tense period and gloomy forecasts, Klaipėda Port managed quite well to compensate the losses of sanctioned cargoes. The significantly growing flow of containers manifests attractiveness of the port for sea cargoes. Besides, the Port Authority is not reducing its investment rates into the port’s development, so that we could stay competitive and were ready to receive new cargoes,” – says Algis Latakas, Director General of Klaipėda State Seaport Authority.
18,08 million tons of cargoes were stevedored in Klaipėda Port in January-June, where half consisted of general cargoes, the quantity whereof increased by almost 18 percent – up to 8,98 million tons.
| Cargo | Volume | Change, % | Difference, tons | |
|---|---|---|---|---|
| Jan-Jun 2021 | Jan-Jun 2022 | |||
| Klaipėda Port | 22 050 340,5 | 18 077 067,8 | –18,0 | –3 973 272,7 |
| Liquid cargoes | 3 541 113,0 | 3 739 094,9 | 5,6 | 197 981,9 |
| Bulk cargoes | 10 891 347,3 | 5 355 034,3 | –50,8 | –5 536 313,0 |
| General cargoes | 7 617 880,2 | 8 982 938,6 | 17,9 | 1 365 058,4 |
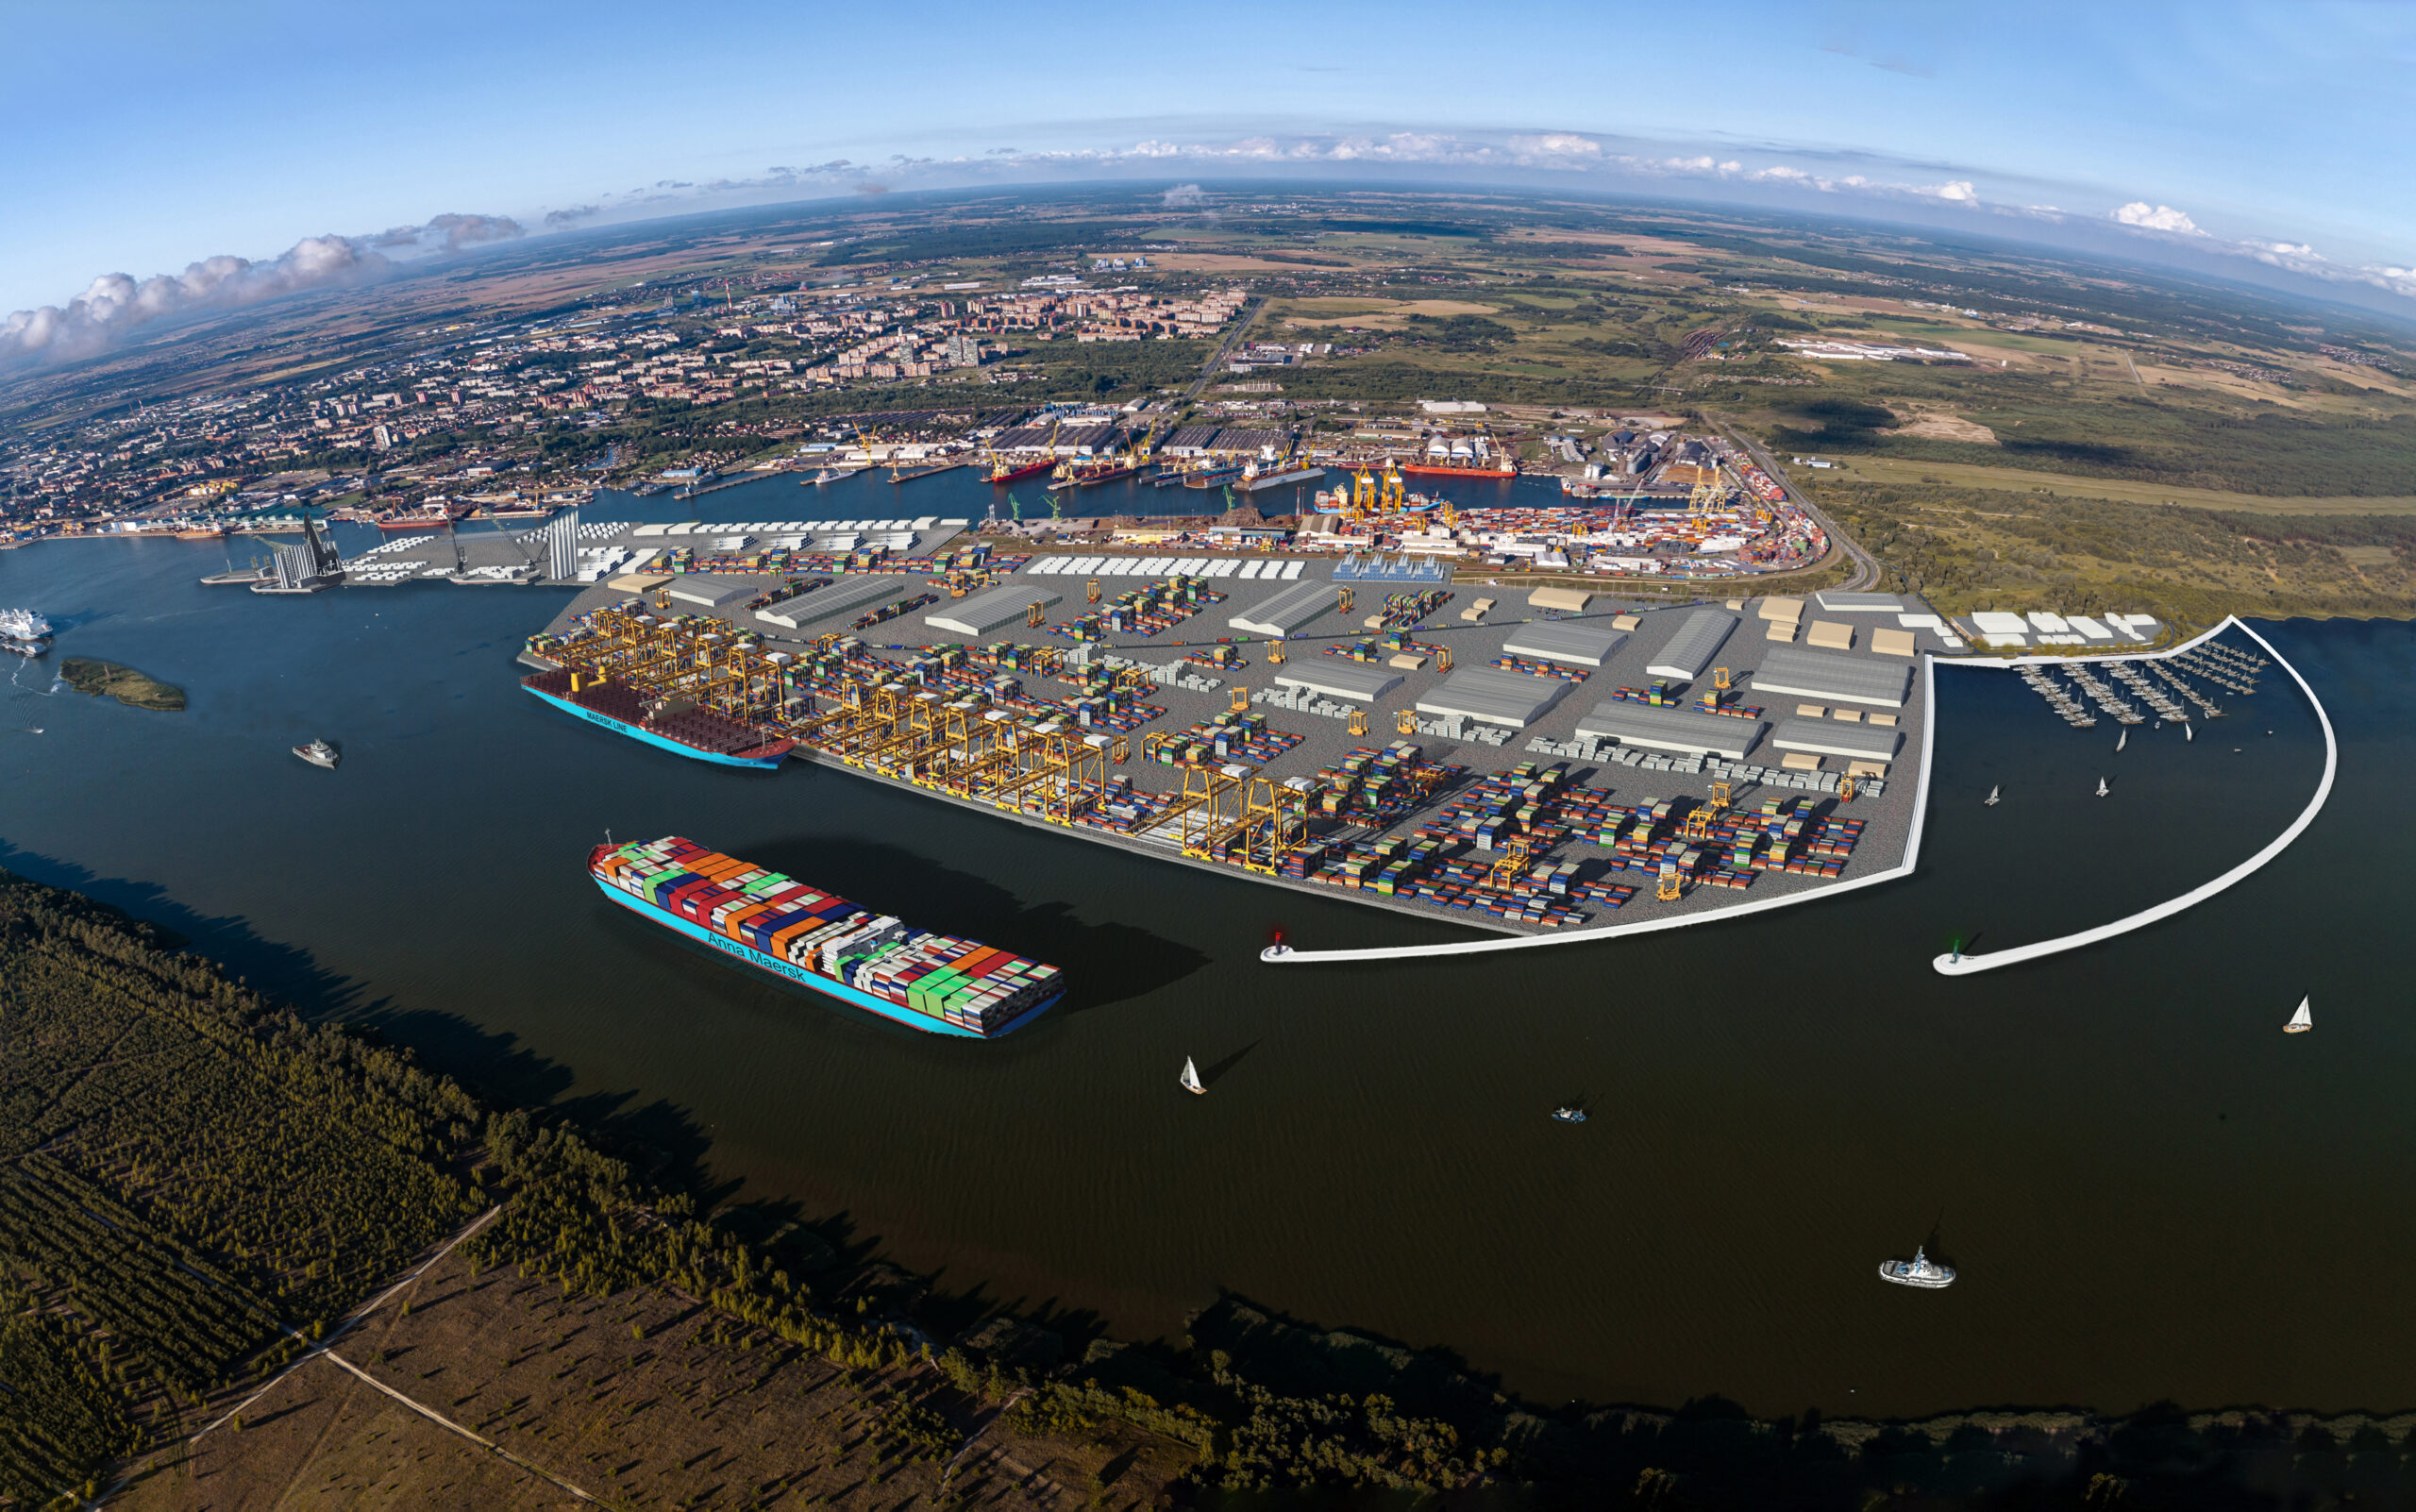
The container stevedoring was growing the most in the segment of general cargoes consisting of containers, ro-ro, iron and steel, metal constructions and refrigerated cargoes. The container growth of 64,5 percent was recorded in six months of this year. There is no doubt that the changes of port dues introduced by the Government’s resolution in the beginning of the year have contributed to the growth of the aforementioned flows. The 100 discount for tonnage due is applied to vessels coming to Klaipėda Port and carrying transshipment containers.
Container stevedoring in the ports of the Eastern Baltic coast, TEU
| Port | Volume | Change, % | Difference, tons | |
|---|---|---|---|---|
| Jan-Jun 2021 | Jan-Jun 2022 | |||
| In total | 1 869 405 | 1 646 559 | –11,9 | –222 847 |
| Saint Petersburg | 1 037 549 | 669 126 | –35,5 | –368 423 |
| Klaipėda | 291 259 | 479 112 | 64,5 | 187 852 |
| Riga | 203 878 | 240 956 | 18,2 | 37 078 |
| Tallinn | 109 932 | 146 821 | 33,6 | 36 889 |
| Kaliningrad | 206 613 | 92 255 | –55,3 | –114 358 |
| Liepaja | 5 032 | 9 572 | 90,2 | 4 540 |
| Ust-Luga | 14 993 | 8 546 | –43,0 | –6 447 |
| Ventspils | 149 | 171 | 14,8 | 22 |
2 739 vessels came to Klaipėda Port in the first half-year of this year, i.e., 14,8 percent less. However, the flow of passengers has increased. Klaipėda was visited by 114 655passengers, i.e., 54,8 percent more than in January-June 2021.
According to the stevedoring results of six months, Klaipėda remains in the strong fourth place among the ports of the Eastern Baltic coast.
Stevedoring in the ports of the Eastern Baltic coast, thousand t.
| Port | Volume | Change, % | Difference, tons | |
|---|---|---|---|---|
| Jan-Jun 2021 | Jan-Jun 2021 | |||
| In total | 179 441,9 | 176 883,4 | –1,4 | –2 558,5 |
| Ust-Luga | 52 912,3 | 58 352,3 | 10,3 | 5 440,0 |
| Primorsk | 26 118,8 | 30 498,1 | 16,8 | 4 379,3 |
| Saint Petersburg | 30 639,3 | 21 413,2 | –30,1 | –9 226,1 |
| Klaipėda Port | 22 050,3 | 18 077,1 | –18,0 | –3 973,3 |
| Butingė Terminal | 3 327,4 | 3 451,5 | 3,7 | 124,1 |
| Riga | 10 149,5 | 11 319,5 | 11,5 | 1 170,0 |
| Tallinn | 11 168,0 | 9 518,0 | –14,8 | –1 650,0 |
| Vysotsk | 8 417,2 | 7 909,2 | –6,0 | –508,0 |
| Ventspils | 5 835,4 | 7 320,2 | 25,4 | 1 484,8 |
| Kaliningrad | 5 038,8 | 4 702,5 | –6,7 | –336,3 |
| Liepaja | 3 367,0 | 3 880,1 | 15,2 | 513,1 |
| Vyborg | 417,9 | 441,8 | 5,7 | 23,9 |